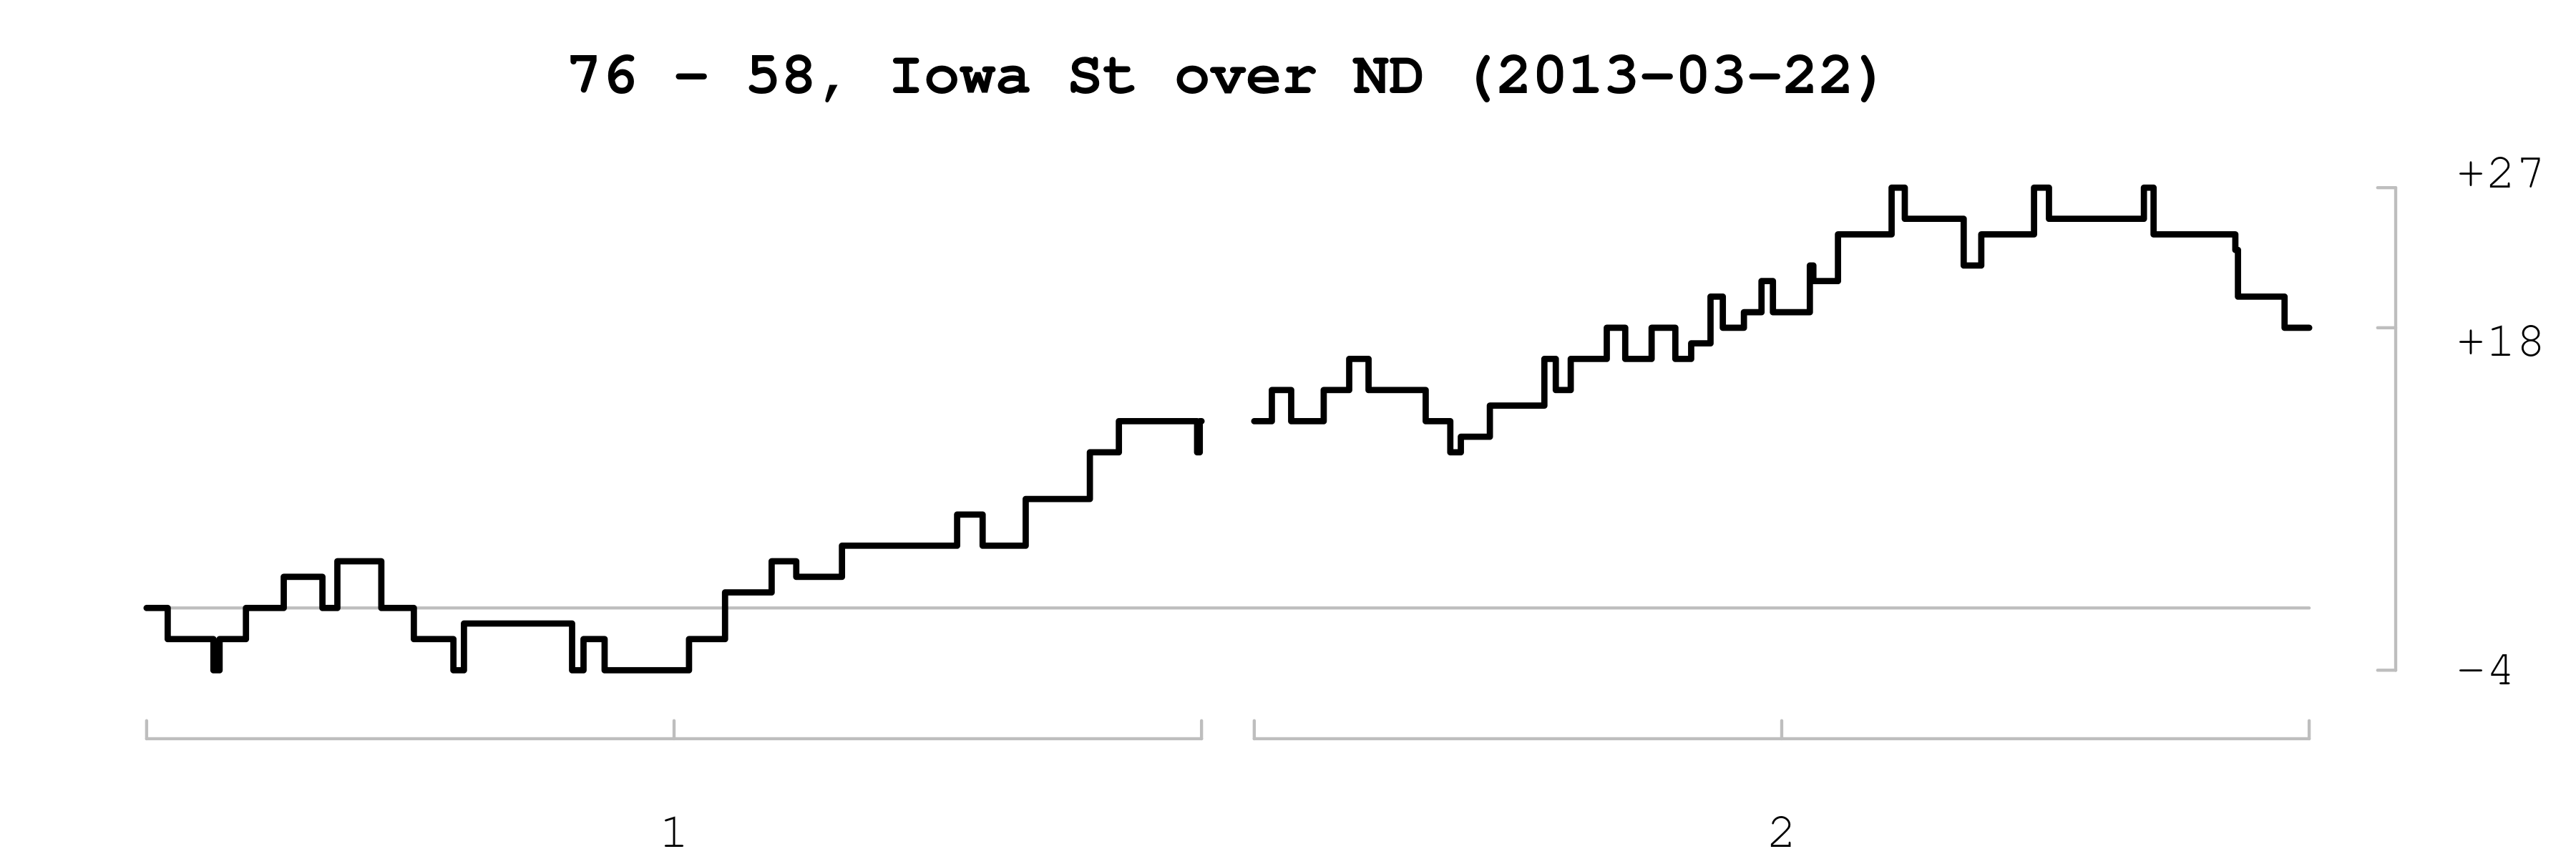
This is an example of the statistical graphs that Gray Calhoun creates for his website VisualScoreboard.com.
AMES, Iowa – With 24-hour sports networks and social media, there is no shortage of sports information and statistics for fans to access. But a desire for better analysis of those statistics led Gray Calhoun, an assistant professor of economics at Iowa State University, to create VisualScoreboard.com.
The website is designed to give fans a breakdown of the game and make projections on future matchups through statistical analysis. VisualScoreboard.com is far from the typical stat sheet fans might find on their favorite sports page. Calhoun creates statistical graphs to visually represent scoring during a game. Each mark on the graph illustrates the difference in the score between the two teams.
“It doesn’t tell you who is scoring or how many shots they’re missing, but it does give you some picture that’s more than just the final score,” Calhoun said.
The site, Calhoun admits, is a bit of a work-in-progress. He started with calculations for NFL games as well as NHL standings. At the request of a friend, he is now also tracking the NBA playoffs.
Calhoun uses a logistic fixed effects model in his calculations of game statistics. That probably doesn’t mean much to the average sports fan, but Calhoun says it is a rather simple calculation that allows him to make projections based on the team’s record and the quality of the opponent. One thing he’s learned is that the playing field is pretty level in the professional leagues.
“You find out, especially when you get to the playoffs, most of the teams are pretty evenly matched. So the probability might be around 55 percent, which is a little bit better than a coin flip, but it’s really not much better than a coin flip,” Calhoun said.
Factoring in the human element
One thing Calhoun can say with certainty is that there is no way to factor human error or judgment into his calculations. He points to the Monday night matchup last fall between the Green Bay Packers and Seattle Seahawks as an example of how one call by the official changes everything.
“That changed the outcome of that game. It doesn’t always happen that dramatically, but it happens all the time that something happens because of officiating or a player having a way better or way worse game than you could imagine,” Calhoun said.
There are also statistical limitations. Teams would need to play thousands of games to provide enough data to reduce the uncertainty with each projection. Calhoun says just like economic forecasting – greater precision depends on having more data available. Still, this hasn’t discouraged him from applying statistical models to the world of sports, even when it doesn’t work in his favor.
“I used the same sort of model to fill out my Final Four bracket this year, and it told me to pick Gonzaga to win the whole thing. So it didn’t make me feel very validated. I thought I had science on my side, but my team was out by the first weekend,” Calhoun said.
Sports vs. economics
As much as Calhoun would like to use the model to pick a winning bracket, more importantly he wants people to see how statistics can apply to everyday life. Calhoun’s work at Iowa State is focused on building statistical tools and methodologies for economists. But the tools can apply to sports as well as elections, as statistician Nate Silver demonstrated in the last presidential race.
“It would be great if this was like a gateway for people to start learning more about statistics,” Calhoun said. “A lot more people find football interesting than find statistics interesting, but in the scheme of things it would be better if people understood statistics more than football.”
Calhoun has lots of ideas on how to grow the website and use the data he collects on each team for better analysis. But for now, he says Visual Scoreboard will remain a hobby. While the actual statistical calculation takes little time to complete, it is the data collection and processing that is very time consuming.